Introduction: The Voice of UK Searches
Across the United Kingdom, people are turning to search engines to express how they feel — often in moments of quiet vulnerability. Each search, each phrase, is a small window into the nation’s emotional landscape.
The Meaningful Paths and VEN Technologies dataset analysed over 600,000 monthly wellbeing-related searches across all 57 UK counties, offering a unique lens into the public voice around loneliness.
Rather than relying solely on surveys or statistics, this approach listens to how people themselves speak — what words they use, what questions they ask, and what concerns they share. It captures the language of need, showing how loneliness is described, understood, and experienced in real time by individuals seeking support, belonging, and understanding.
The following charts highlight three dimensions of loneliness revealed through these searches:
- Where loneliness impacts life most deeply
- What kind of loneliness people feel most
- Where loneliness is most visible or hidden
Together, these perspectives form a portrait of a society that is connected yet disconnected — a country where digital and physical proximity often fail to meet emotional needs, but where the desire for belonging remains strong.

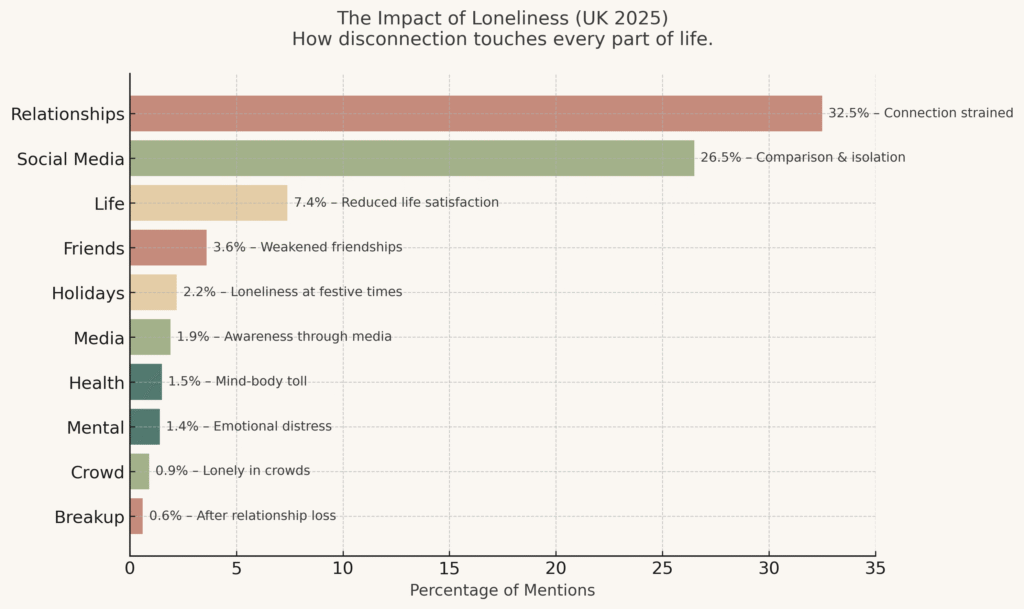
Chart 1: The Impact of Loneliness (UK 2025)
Understanding the Data
This chart visualises what people across the United Kingdom are searching for and speaking about in relation to loneliness.
Each topic represents a cluster of real search terms — how individuals themselves describe their experience of disconnection.
It’s important to remember that people express themselves in their own language and phrasing. Someone might describe “feeling invisible” or “heartbroken” without ever typing the word lonely.
So while the chart shows the dominant themes and wording, many more experiences likely sit behind the data — unseen but deeply felt.
What the Chart Shows
The data reveals that loneliness most often touches the relational and emotional areas of life:
- Relationships (32.5%) — Disconnection from partners, family, or friends.
- Social Media (26.5%) — Connection without closeness.
- Life (7.4%) — A loss of meaning or purpose.
- Friends, Holidays, Health, and Mental Wellbeing — Showing how loneliness weaves through social and emotional life.
Key Indicators
- Over one-third of people associate loneliness primarily with relationships.
- One in four link it to social media, where visibility replaces intimacy.
- Mentions of health and mental health, while smaller, show growing awareness that loneliness is a wellbeing issue, not just a social one.
For Practitioners
For therapists, coaches, and community leaders, this suggests that loneliness cannot be solved by simply increasing social contact. It requires spaces of emotional safety and resonance, where people can feel genuinely understood.
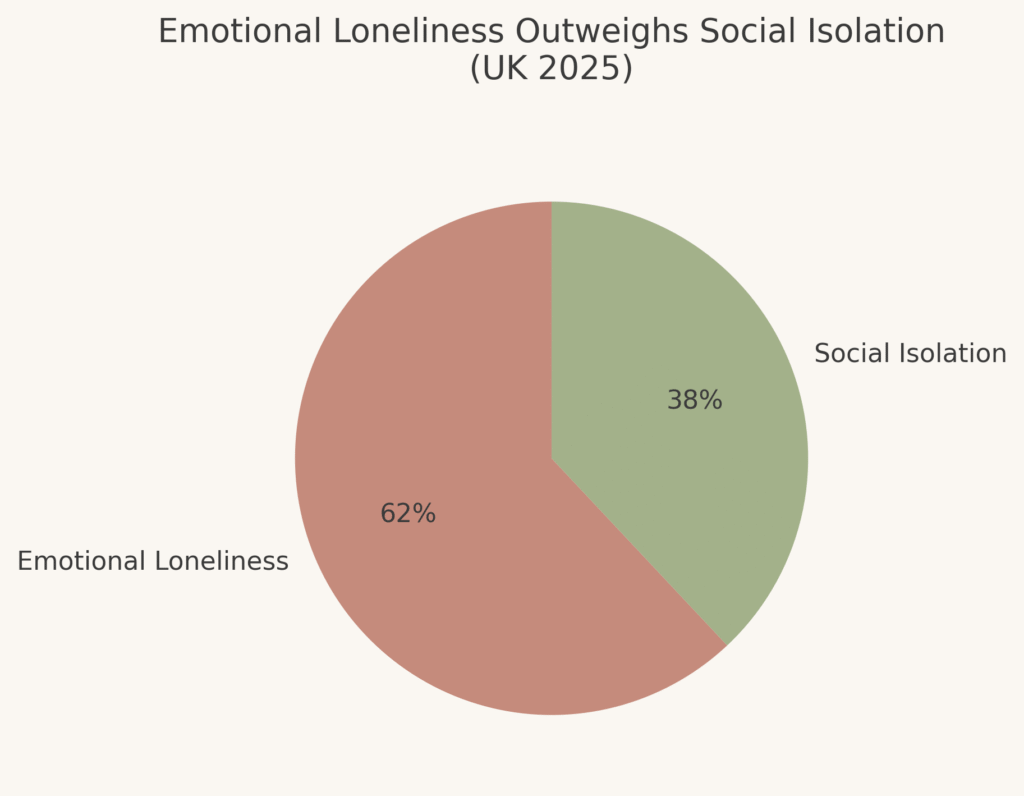
Chart 2: Emotional Loneliness Outweighs Social Isolation (UK 2025)

What the Chart Reveals
Over 62% of UK loneliness-related searches include emotional terms such as “feeling invisible,” “not understood,” or “no one really knows me.”
Only 38% relate to social isolation — being alone or lacking company.
Most people aren’t saying they have no one around — they’re saying they have no one who truly understands them. This reframes loneliness as an emotional and existential experience, not merely a logistical or social one.
Emotional vs Social Loneliness
- Emotional Loneliness — the absence of emotionally resonant, trusting relationships.
- Social Isolation — the physical absence of people or contact.
The data suggests that the UK’s loneliness challenge is not about being alone but feeling unseen.
For Practitioners
This finding invites professionals to focus not just on “adding social activity,” but on fostering depth and authenticity in relationships.
- Therapists can explore relational wounds and unmet emotional needs.
- Coaches can help individuals build emotional literacy and self-connection.
- Community programmes can focus on belonging, not attendance.
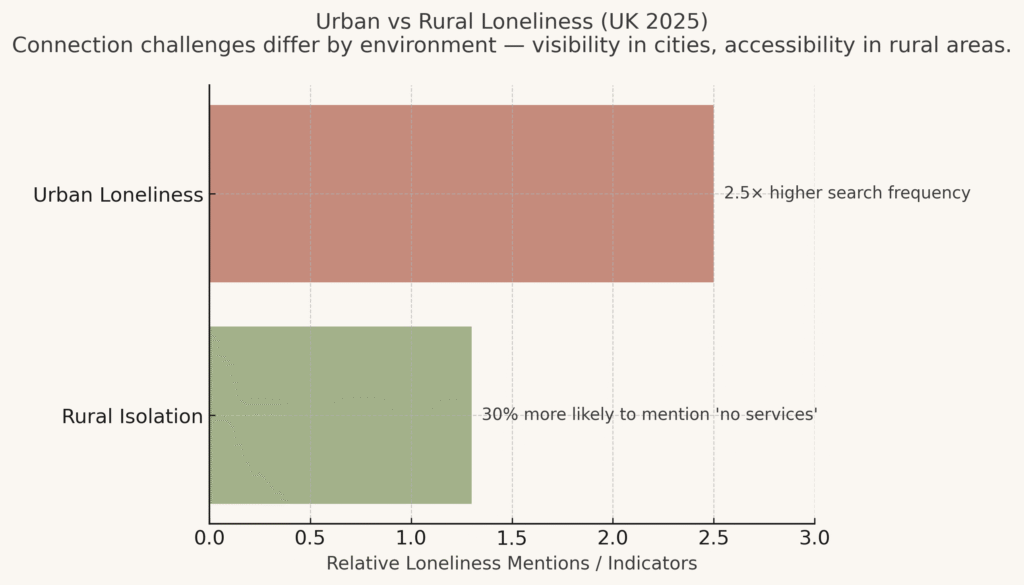
Chart 3: Urban vs Rural Loneliness (UK 2025)

What the Chart Reveals
Loneliness looks different depending on where people live.
In urban areas, loneliness is visible but unspoken — people are surrounded by others yet feel disconnected. Searches such as “lonely in London” and “how to make friends near me” are 2.5× more frequent in cities than in rural regions.
In rural areas, loneliness is quieter but deeper. Rural searches are 30% more likely to include phrases like “no services” or “nowhere local”, reflecting practical barriers to connection and limited local support.
For Practitioners
This distinction highlights the need for context-sensitive approaches:
- Urban initiatives should focus on creating intimacy and belonging amid busyness.
- Rural initiatives should prioritise access, outreach, and sustainable community networks.
In both environments, the challenge is the same: transforming proximity into genuine connection.
Conclusion: From Data to Connection
These insights show that loneliness in the UK is not merely about physical isolation — it is about emotional resonance and meaningful belonging.
Across ages, locations, and lifestyles, people are not simply searching for company — they are searching for understanding, empathy, and shared meaning.
For therapists, practitioners, coaches, and community leaders, this data is a call to listen deeply to how people already express their needs.
When we respond to that voice — the real, everyday language of loneliness — we can design experiences, spaces, and relationships that rebuild connection from the inside out.
“The voice of the UK’s searches tells a story of yearning — not for more noise, but for more meaningful paths to connection.”
References
Data Source: Meaningful Paths Ltd and VEN Technologies.

